Polygon
توقعات نمو السلاسل العامة
Context
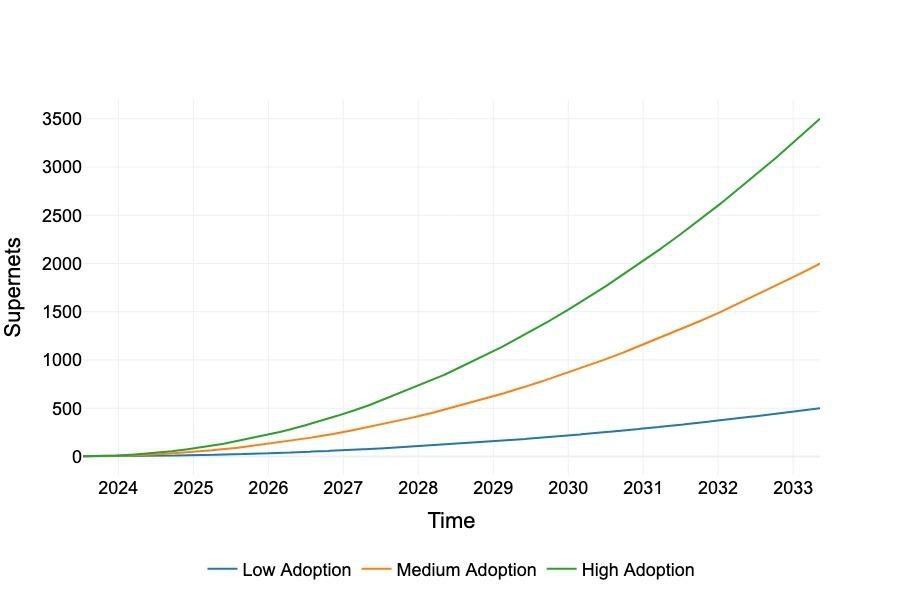
This figure appears in the Economic Model section of the Polygon 2.0 tokenomics whitepaper, which builds a demand-side model for POL by projecting the growth in validator demand driven by public Polygon chains (zkEVM mainnet and future public rollups). The section models validator demand growth separately for public chains and Supernets because they have different adoption dynamics.
What This Figure Shows
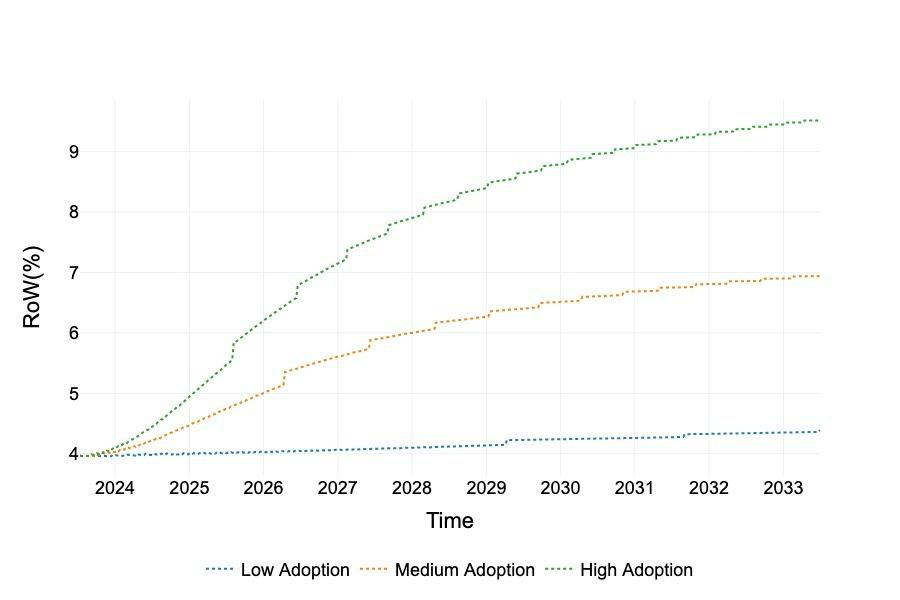
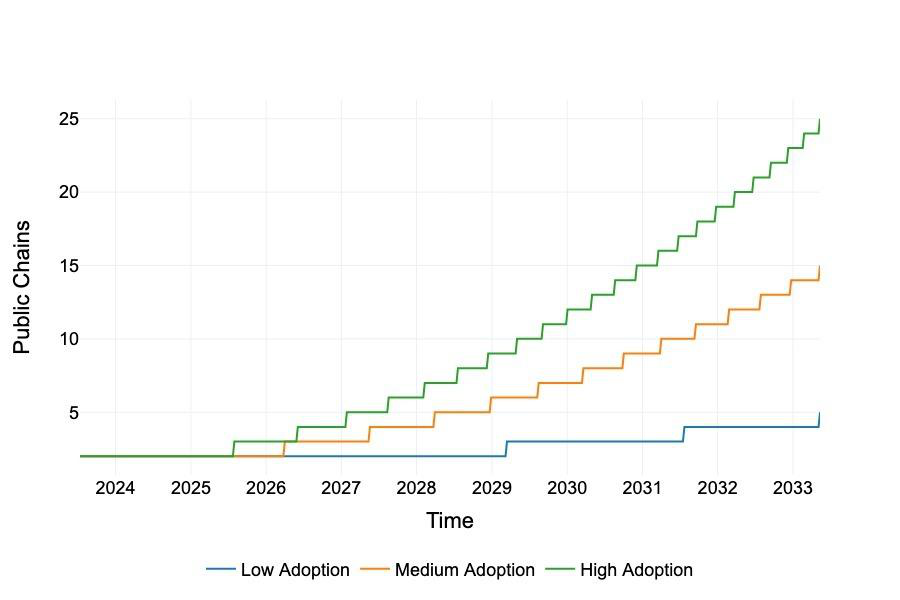
The chart projects the number of active public Polygon chains over time under various growth scenarios, modeled as S-curve adoption trajectories informed by Ethereum L2 proliferation and other multi-chain ecosystems. Each additional public chain increases total validator demand because the Polygon 2.0 model allows validators to simultaneously secure multiple chains and earn fees from each — meaning chain growth directly increases economic opportunity per staked POL. The scenarios span conservative, base, and optimistic cases. The chart is used downstream to project total transaction fee revenue, which feeds into return-on-work calculations.
Significance
Public chain growth is the primary demand driver for POL in the near term, because public chains generate the highest transaction volumes and largest fee streams. This figure grounds the tokenomics projections in concrete adoption scenarios rather than arbitrary assumptions and makes explicit that the economic model's conclusions are scenario-dependent.