Aave
Aave
대출 풀 기본 구조
Context
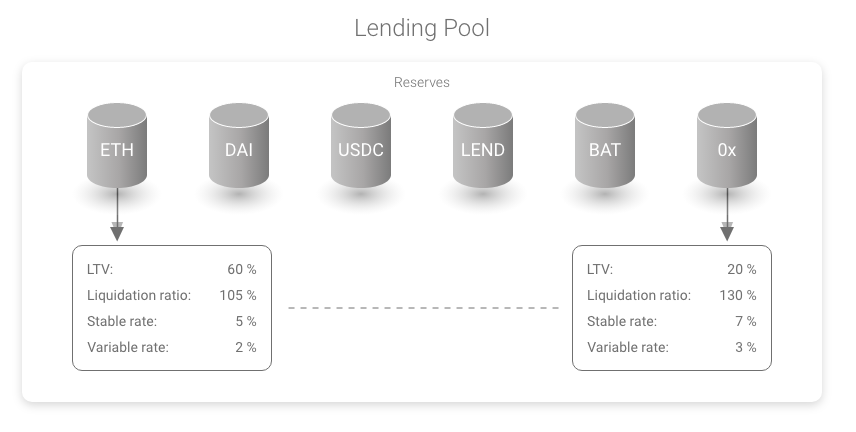
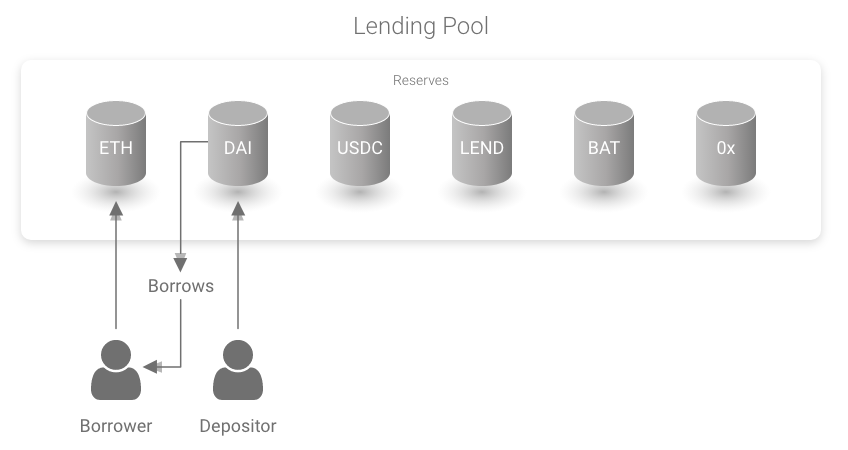
This figure accompanies the 'Basic Concepts' subsection of the introduction, explaining the core mechanics of how reserves work within a lending pool. It is the second figure in the whitepaper and illustrates the deposit and borrow flow together with interest accrual. The diagram introduces the reserve as the central data structure holding multiple currencies.
What This Figure Shows
The Lending Pool Basics figure depicts how each reserve holds a pool of a specific asset, accepts deposits from lenders, and allows borrowers to draw funds against collateral. When a user deposits, they contribute to the total liquidity (Lt) of the reserve and receive aTokens proportional to their share. Borrowers lock collateral in a separate step and receive the requested funds; interest accrues continuously on outstanding borrows and is passed back to depositors through the cumulated liquidity index. The figure also illustrates that the system supports both stable and variable interest rate modes on the borrower side, which feeds into separate accounting tracks (Bs for stable borrows, Bv for variable borrows). Utilization (U = Bt / Lt) is the key metric that drives the interest rate model.
Significance
This figure makes the pool-based lending model concrete by showing how supply-side deposits and demand-side borrows interact through a shared reserve. It is the reader's first look at how interest flows from borrowers to depositors without any intermediary, which is the core value proposition of Aave. Understanding this diagram is a prerequisite for following the formal variable definitions in Section 1.2 and the interest rate formulas throughout the whitepaper.