Polygon
Kịch bản phát hành POL Validator
Context
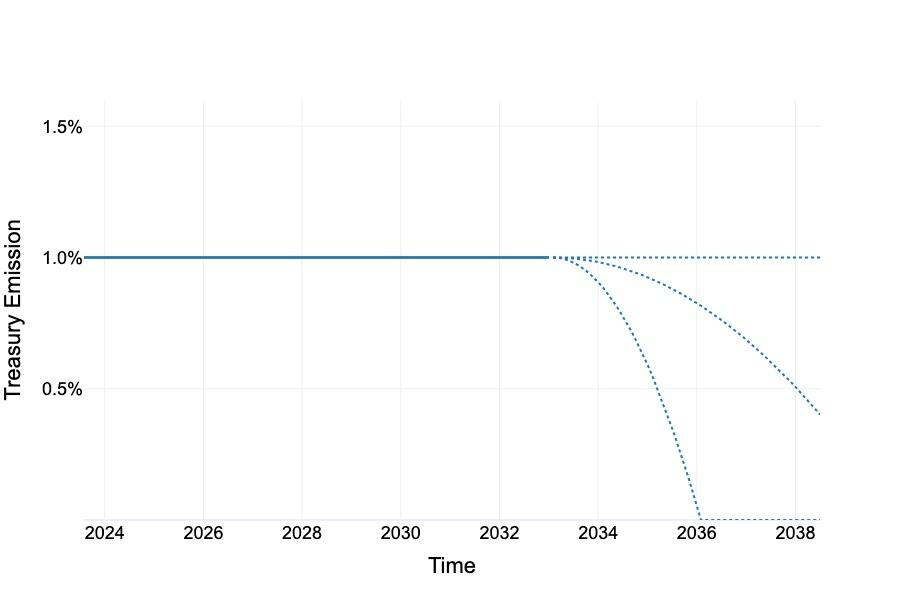
This figure appears in the Supply section of the Polygon 2.0 tokenomics whitepaper, which specifies the POL token emission schedule. The section models POL issuance as two separate streams — one for validators and one for the community treasury — and presents several scenarios corresponding to different assumptions about validator participation and chain adoption rates.
What This Figure Shows
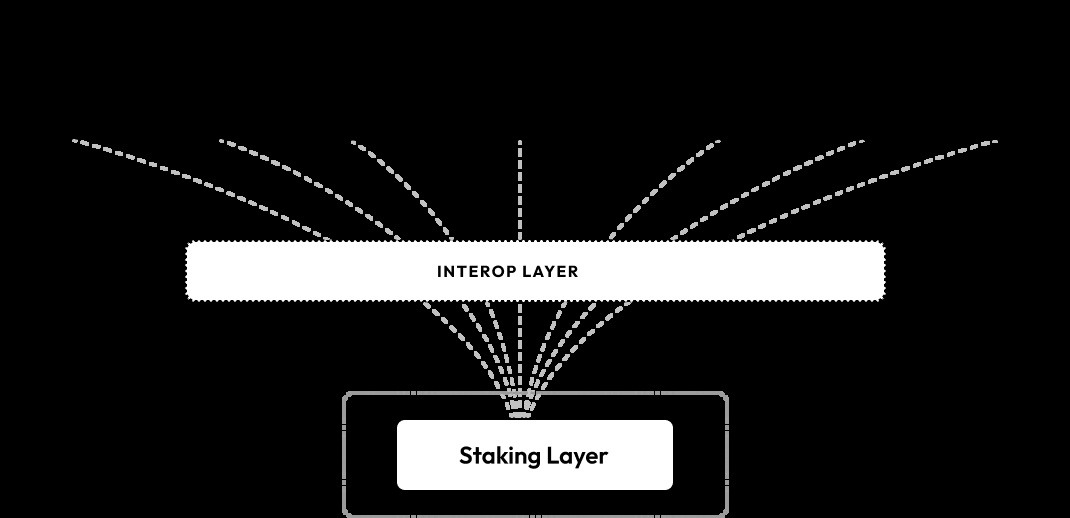
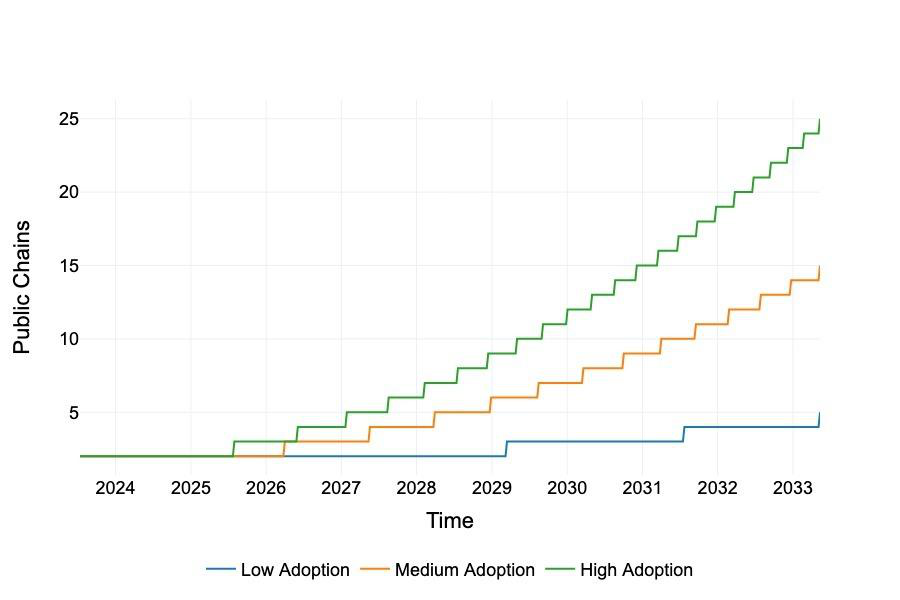
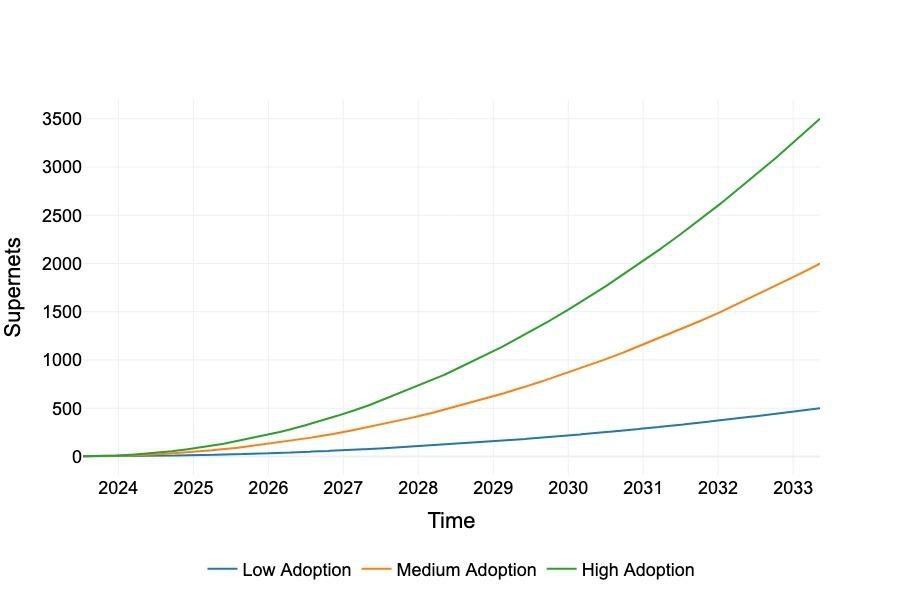
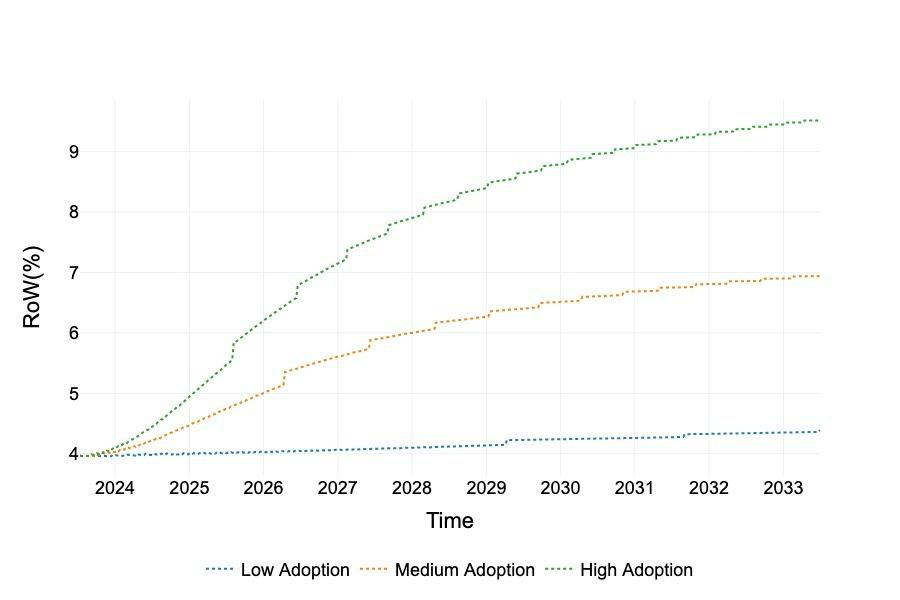
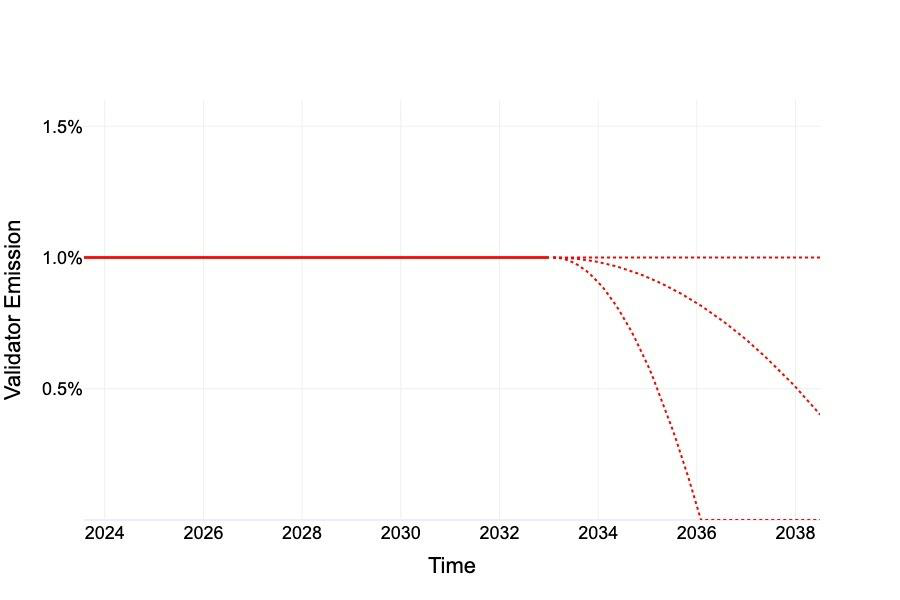
The chart plots the validator reward emission of POL tokens over time under multiple scenarios, parameterized by how many Polygon chains validators simultaneously support and at what fee levels. At the base, validators receive annual issuance proportional to their staked POL, calibrated to be competitive with other PoS networks. In optimistic scenarios where validators secure many Supernets and collect significant fees, the required issuance subsidy decreases because fee revenue partially substitutes for inflation-funded rewards. The pessimistic scenario requires higher sustained issuance to maintain validator participation, representing the worst-case dilution path.
Significance
Validator emission is the primary inflation driver for POL and the key variable for assessing dilution risk. By presenting multiple scenarios rather than a single deterministic projection, the whitepaper acknowledges fundamental uncertainty in future chain adoption. The figure also shows how POL's multi-chain validator model creates a flywheel: greater chain adoption reduces required issuance, benefiting existing holders.